Neutral Hydrogen (HI) Observations
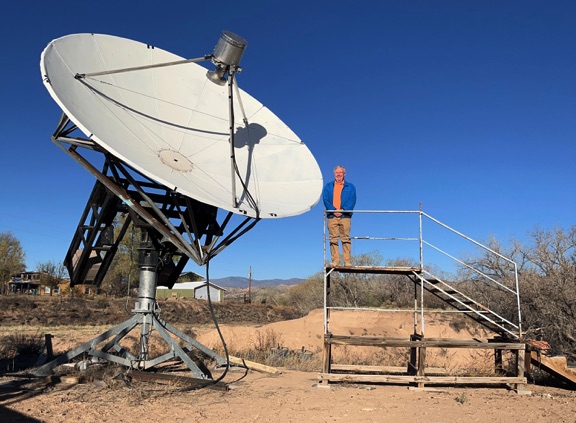
Above: 4.6m dish configured for neutral hydrogen observations at 1420 MHz
Velocities associated with Doppler-shifted frequencies are calculated by
v = c (fo-f) / fo,
where v is the radial component of the relative velocity between the observer and the source, c is the speed of light (3 x 10^8 m/s), fo-f is the Doppler shift amount, and fo is the unshifted frequency of neutral hydrogen (1420.40575 MHz). By arbitrary convention and agreement among astronomers, Doppler-shifted velocity components in directions that are away from the observer are designated as positive whereas Doppler-shifted velocity components that are directed toward the observer are designated as negative.
As mentioned above, the measured frequencies have been corrected for the local standard of reference so that these data may be directly compared with measurements taken at any other time by any other observatory that also uses the LSR as its spatial reference point for celestial frequency measurements.
EARLY (circa 2008) UNCORRECTED NEUTRAL HYDROGEN LINE OBSERVATIONS FROM VARIOUS RADIO SOURCES
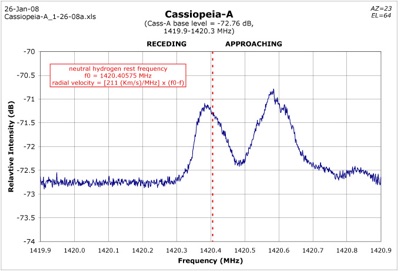
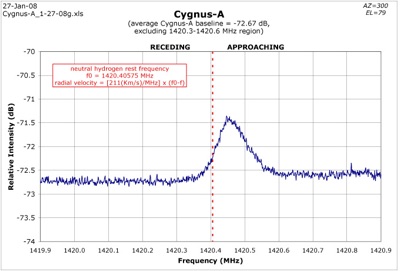
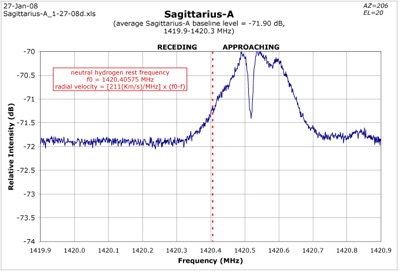
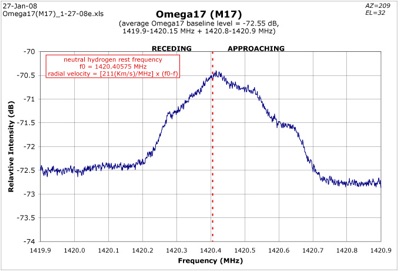
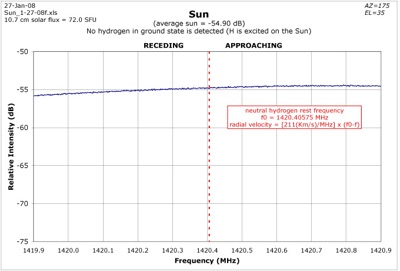
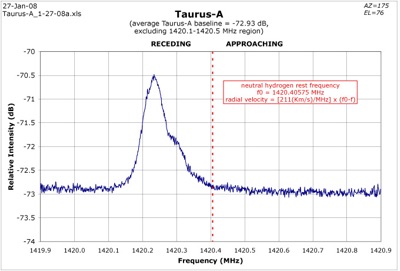
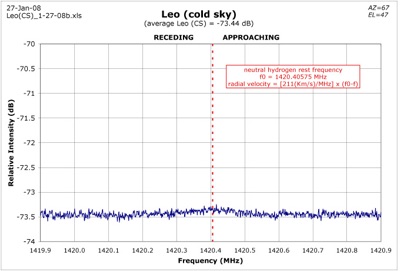
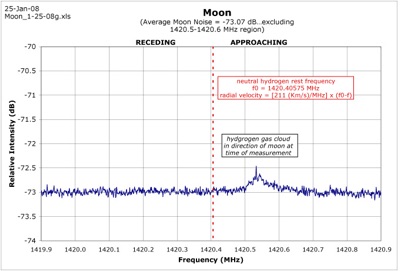
The following graphs display early data of ours which have NOT been referenced to the local standard of rest. They are, instead, 'signal-averaged-intensity versus frequency' plots obtained directly from the SDR-14 using the SpectraVue program in its normal (default, frequency domain) mode with a 1 MHz bandwith centered on 1420.4 MHz and an approximate 10-minute acquisition time for each. The data were initially saved using the spreadsheet output format option of the SDR-14/SpectraVue then imported into MS Excel as a text file. The data were plotted and annotated using the Chart Wizard feature in Excel. The resulting chart was then printed to file in PDF format and converted into JPEG format using Adobe Photoshop Elements for posting on the website as a JPEG image.
Neutral hydrogen at rest (in the radial direction) with respect to us would appear as a peak precisely centered on the dashed red line at 1420.40575 MHz. Peaks appearing higher in frequency than the red dashed line are due to hydrogen gas approaching us radially and peaks appearing a frequencies lower than the red dashed line are due to hydrogen gas receding from us radially. No information is available in these data with respect to velocity components of the gas that may be perpendicular to the line of sight. The H I line signals shown in these graphs are on top of, i.e., combined with, the broad-band background radiation from the sourcces. That is, at 1296 MHz for example, one would see only broadband radiation from these sources without the H I line peaks shown below. No calibration noise pulses were used during the collection of these particular HI line data. The noise pulses will be used in later measurements when the system is configured as a radiometer incorporating PIN diode rf switching and a synchronous, lock-in amplifier detector (not shown in the configuration diagram above) to obtain absolute power measurements of radio sources.
"HI" LINE MEASUREMENTS IN THE PLANE OF THE MILKY WAY GALAXY
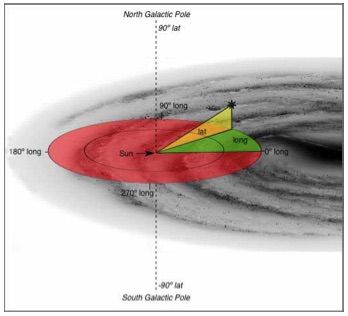
Earth-bound measurements of the internal structure of the Milky Way galaxy are best referenced to the GALACTIC COORDINATE SYSTEM. This coordinate system is illustrated below superimposed upon a depiction of the Milky Way galaxy. The origin of the coordinate system is located at the position of our solar system with the sun at the origin with 0 degrees longitude aligned toward the center of the galaxy.
Ref: The above image was obtained from http://www.tthinkastronomy.com/M13/Manual/common/galactic_coords.html without permission.
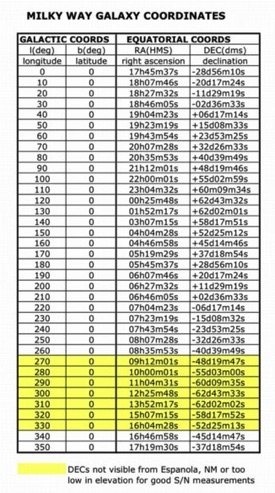
In order to track specific galactic longitude/latitude directions with a radio telescope it is necessary to convert galactic longitude/latitude coordinates into Right Ascension/Declination coordinates which then must be converted to azimuth/elevation coordinates for the telescope at the particular observatory location, date, and time of day of the observation. A conversion of some of the galactic coordinates for directions along the principal plane of the Milky Way (i.e., latitude = 0) is shown in the image below. Note that some galatic longitude directions are not visible at any time from my particular New Mexico observatory.
Measurements of emissions from neutral hydrogen along the principal plane of the Milky Way galaxy have been performed using the 4.6m dish shown above. The measurements consisted of frequency spectra collected at given galactic longitudes along the galactic plane (i.e., always b = 0). A summary of the measurements is shown in the image below in which velocities of the neutral hydrogen have been obtained from the measured Doppler shifted frequencies observed, after correction for the local standard of rest (LSR).
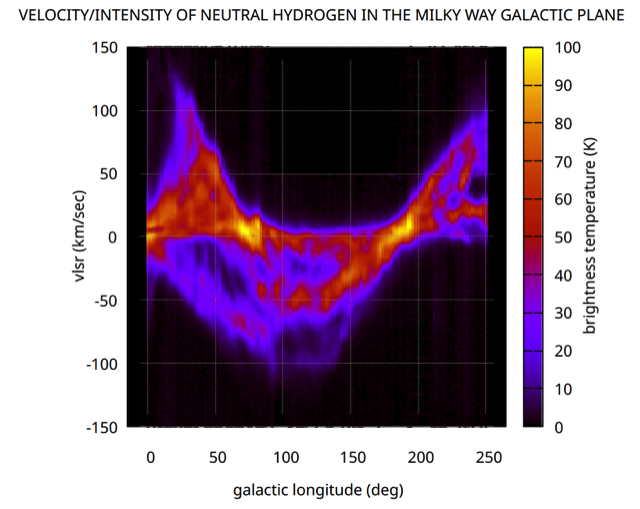
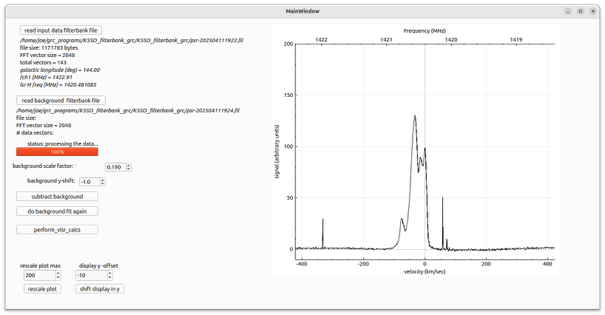
The above image (April 2025) consists of 260 vertical scans, each of which is similar to the representatve measurement at 144 degrees longitude shown in the plot in the image below. The sharp, narrow features in the plot below are due to radio frequency interference received during the 2-minute tracking acquisition at 1420.4 MHz using 5 MHz bandwidth with the Ettus USRP X310 dual-channel (H & V polarizations summed) software defined radio. The ploting software is custom written in Qt/C++ by K5SO to achieve the scaling, LSR correction, etc.
Above: Galactic latitudes (l) within the principal plane of the MilkyWay (b =0) and corresponding RA/DEC values.
Above: Summary graph of our neutral hydrogen study of the Milky Way galaxy along the principal plane, showing intensity of the signal, galactic longitude of the observation, and cloud velocities relative to the Local Standard of Reference.
Above: Representative spectral measurement of one of the 260 such measurements comprising the summary image. Each spectral measurement maps to one vertical line in the summary image.